
What is a Group?
Groups work like folders in that they organise resources and can be expanded/contracted to show/hide these resources on the diagram.
Groups often relate to cloud concepts such as VPCs, Subnets, and Virtual-Networks.
By default groups start off collapsed, like this:

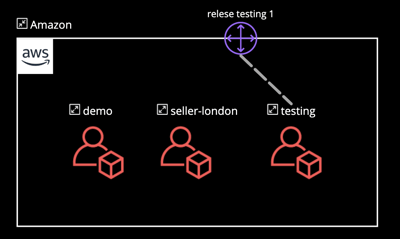
Selecting a group icon will bring up the corresponding resource detail view. Alternatively, select a group's label to expand (or collapse) the group and show (or hide) its contents.
In this example, the expanded group contains one customer gateway node and three "sub" groups of type 'Account' that we can now see: demo, seller-london and testing.
You can also automatically expand subgroups by selecting the expand icon in the top-right corner of a group. Take care when expanding very large topologies as this can be costly performance-wise.
The  Group Summary View
When you select a group, Hyperglance shows you the group dashboard with 'Summary', 'Attributes' and 'Alarms' tabs.
The 'Summary' tab is initially what you see, and gives you a list of all the entities contained within that group:
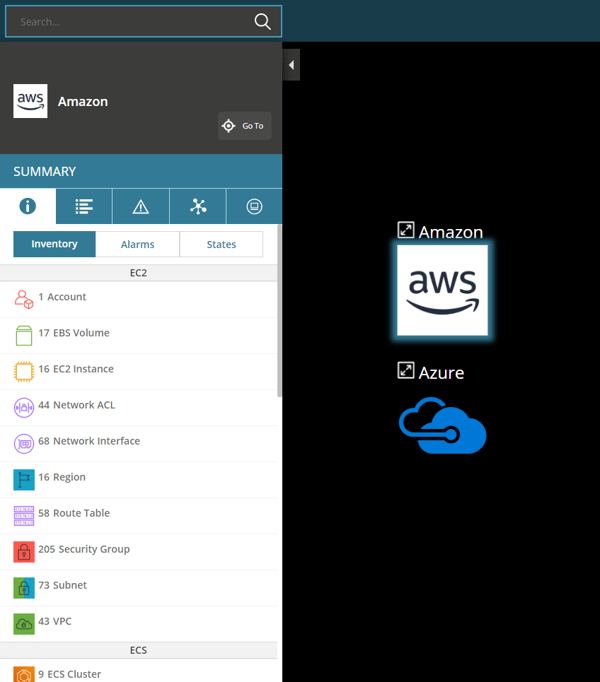
Use the tabs to display an inventory list (as above) or to display donut charts about either alarms of the entities or running states of the entities.
Click on any entry to display an inventory table listing all corresponding entities contained within this group: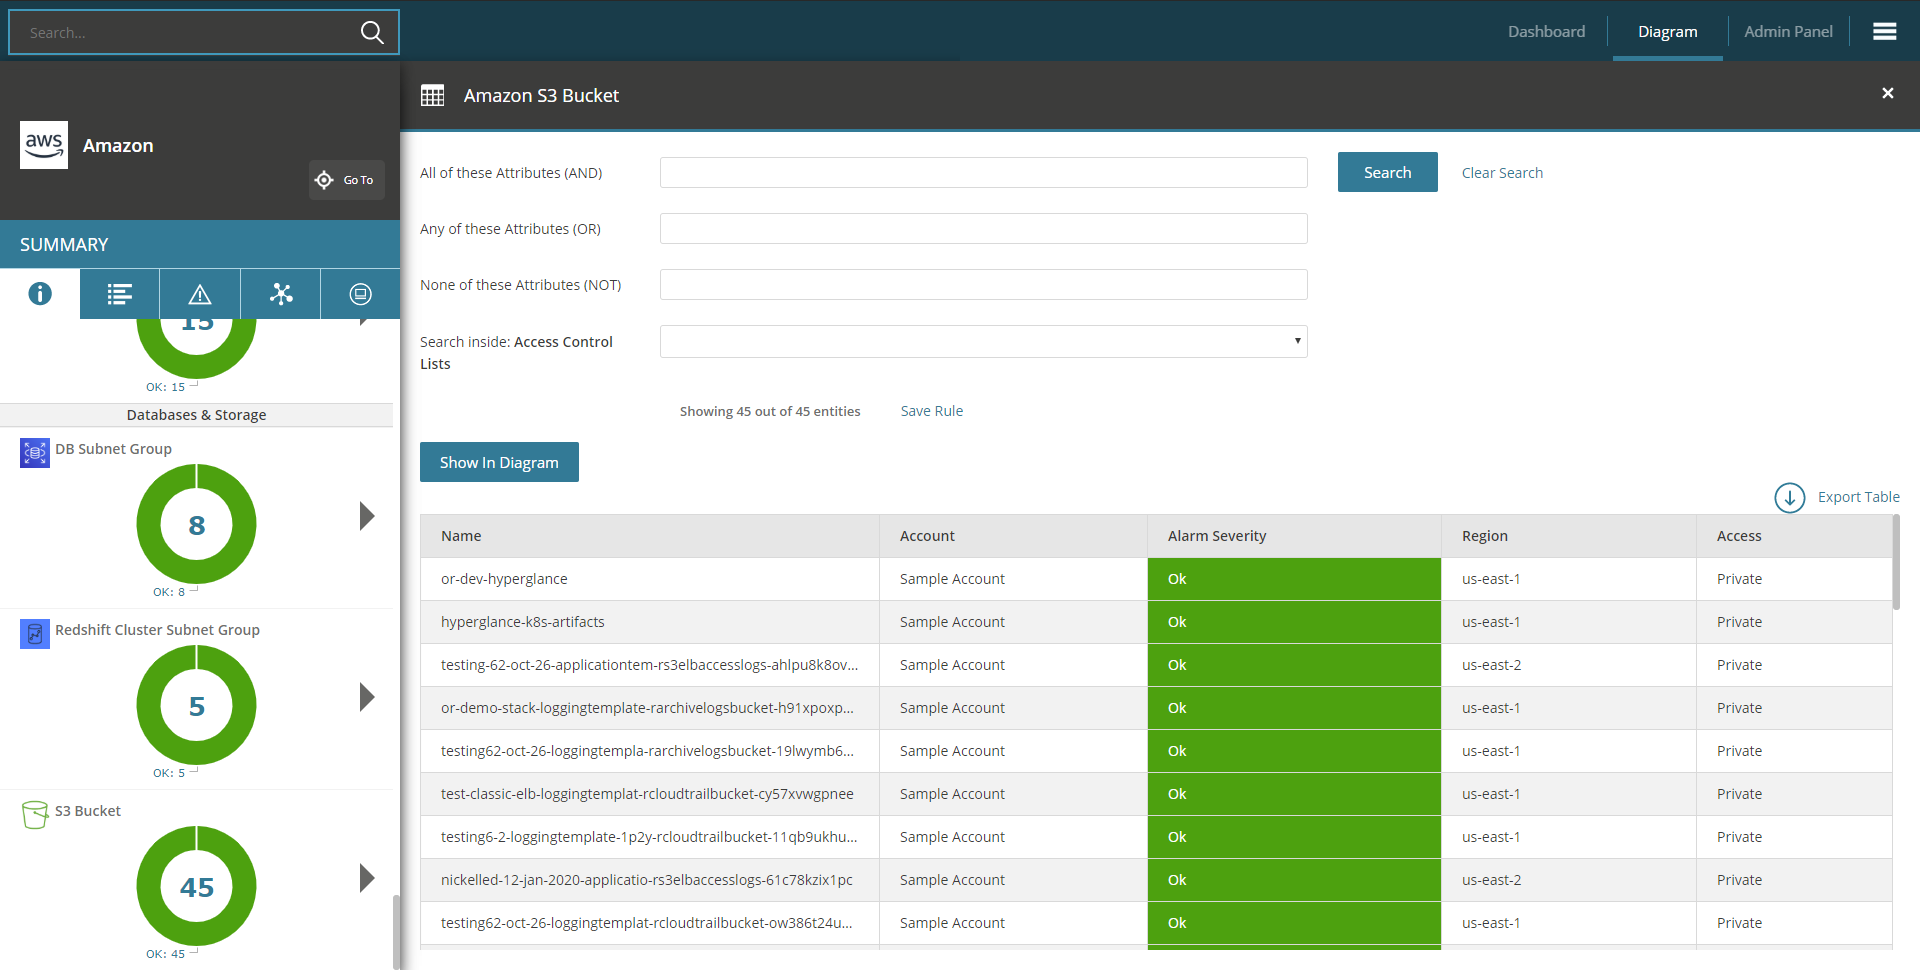
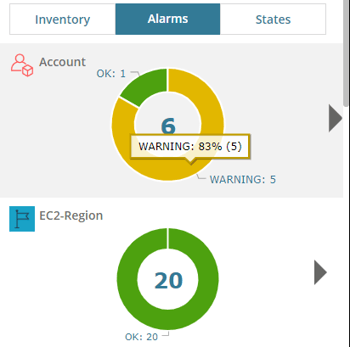
When viewing donut charts about the alarms or states the big number in the center of the donut is the total number of entities. You can see percentages by hovering.
Searching Within a Group Summary
When you click on any group and then click on any entry in its summary tab (such as EC2 Instance in the example screenshot below) then Hyperglance will display a table of all the corresponding entities within that group. From here you can conduct sophisticated searches over the entries in the table using the search box at the top:
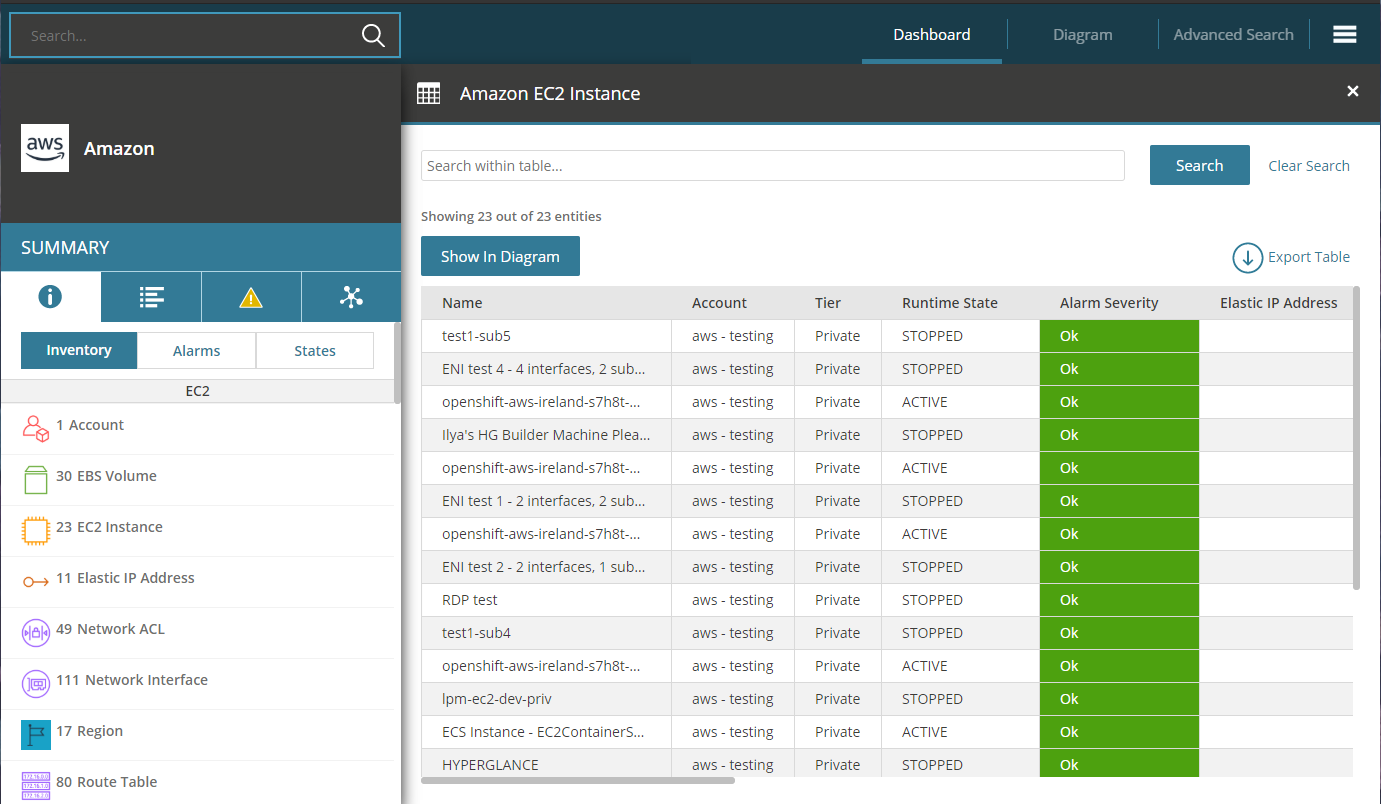
The search allows you to enter AND search terms of the entity type Attributes.
The easy way to use these search boxes is to rely on the auto-complete dropdowns that appear after you click inside a textbox. But you can also read the syntax rules later on in this article if you want to gain some extra control over the search queries.
An Example
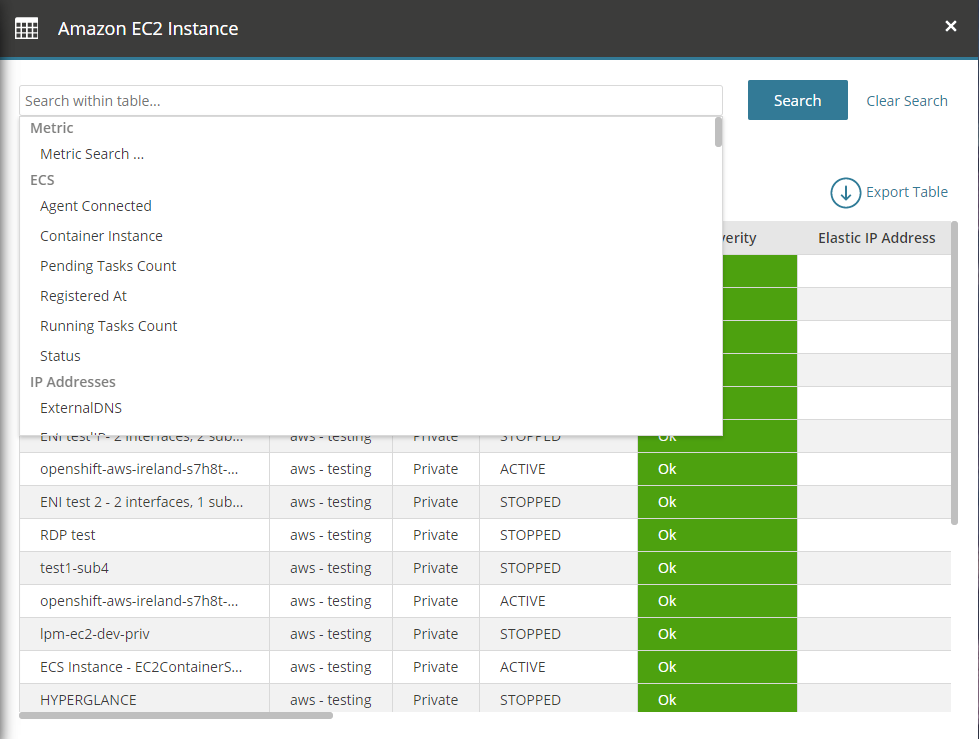
Here we have selected Amazon EC2 Instance to search over.
Click inside one of the search boxes to reveal an auto-complete dropdown of available attributes to search against:
You can also just start typing to filter the dropdown:
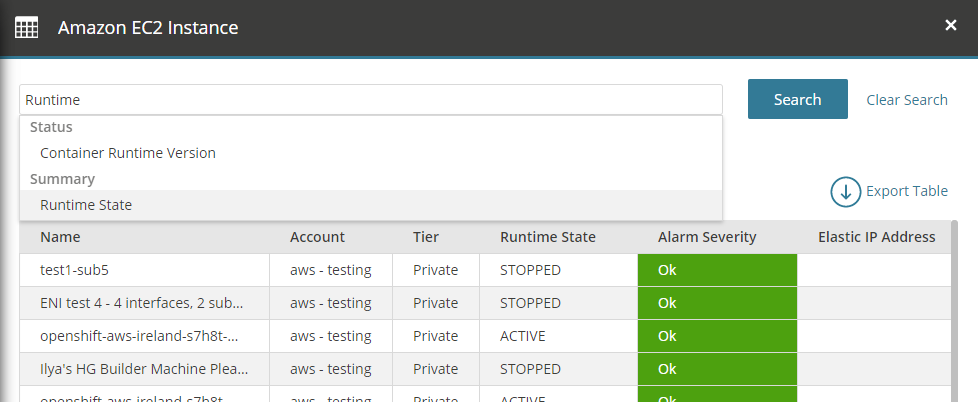
After an attribute name has been selected (here we chose 'Runtime State', you are now prompted to choose an attribute value. This auto-complete dropdown provides you with possible values that currently are being used in your dataset but you are free to enter other values (or even parts of values).
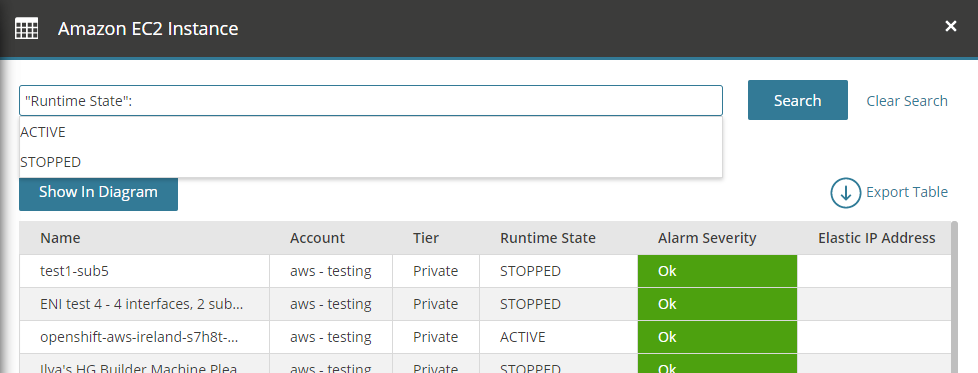
In this example clicking on 'Search' button will give you all the EC2 Instance with Runtime State: ACTIVE:
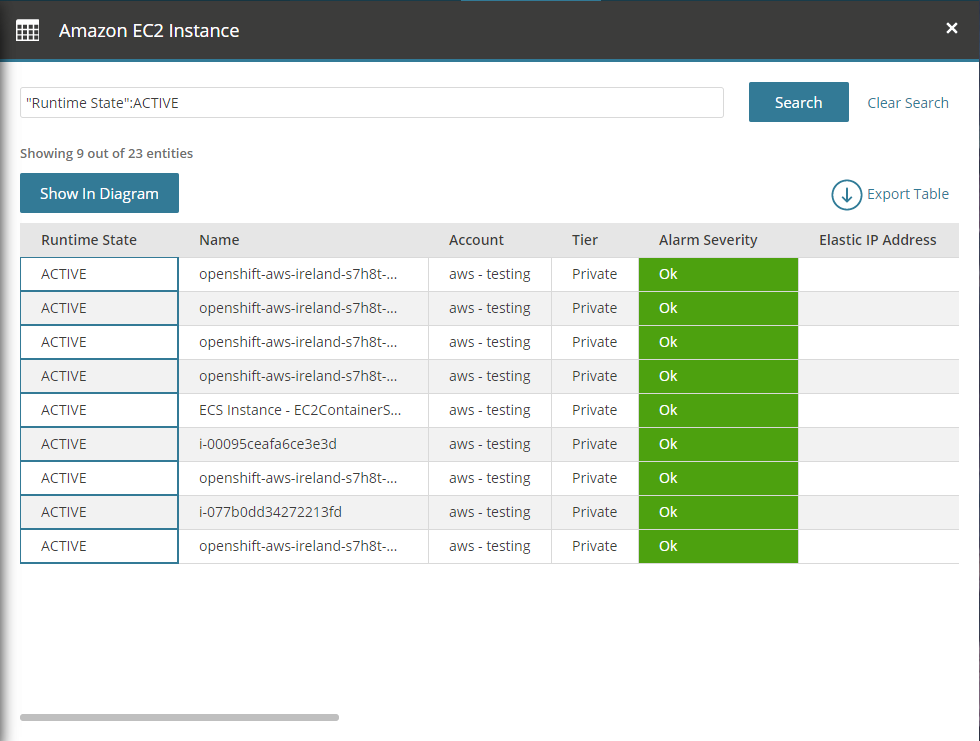
The matched column will have a Blue border as shown. The results show that 9 out of 23 matched these criteria.
Adding further criteria like Instance Type: m4.large reduces the result to 3 records:
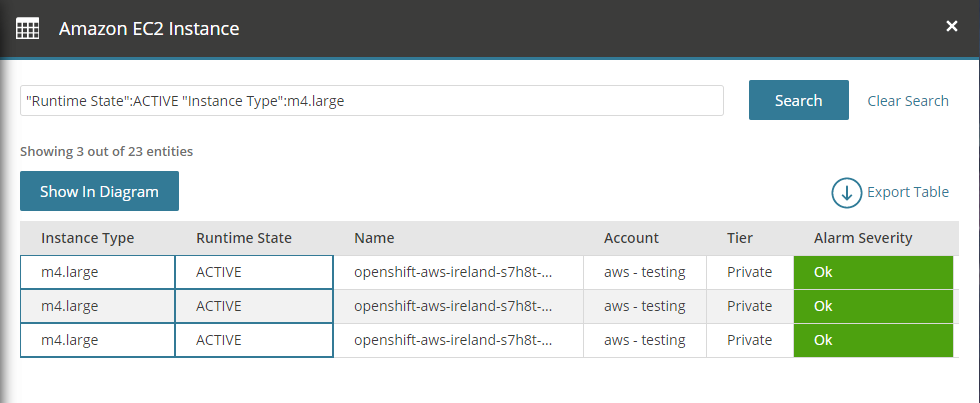
The table headers/key can be clicked to sort the data based on the values under it.
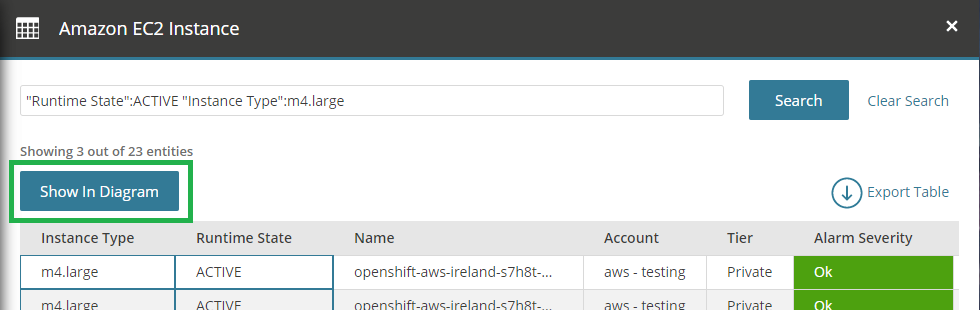
Once you have found a specific set of resources you can create a diagram view from them by clicking the 'Show in Diagram' button:
Searching Metrics
It is also possible to search from the entities' metrics by using the following comparison operator:
- = and == for Equal
- != and <> for Not Equal
- < for Less Than
- <= for Less Than or Equal
- > for Greater Than
- >= for Greater Than or Equal
Steps:
- Click the search field and select "Metric Search"
- Select the metric that you want to search from
- Select metric roll up (Average, Maximum, Minimum, Sum, ...)
- Select metric period duration (Hour, Day, Week, Month)
- Select the comparison operator
- Enter a numerical value
- Press the Search button (or hit enter)
Note: You can add as many attribute or metric search terms as you wish, simply separate them with a space in the textbox

Note: A metric that returns a 'null' will have its value treated as 0.0 (zero).
Exporting a Table
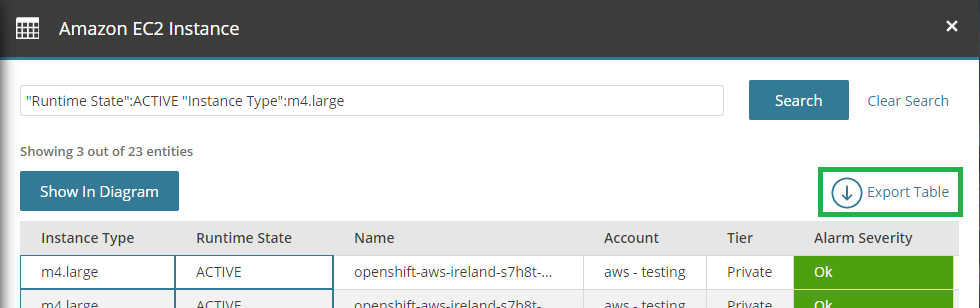
After the search returned some results, the data can be exported using the "Export Table" button at the top right corner of the table. A CSV file containing the data in the table will then be downloaded by the browser.
Search Syntax Rules
- Key:Value searching:
- Enter the exact key of an attribute or table column name, followed by a colon (do not use whitespace around the colon!), followed by a value. The value is case-insensitive and need not match fully.
- E.g. Color:bl will match an attribute called Color looking for a value containing "bl" (e.g. "blue" and "black" would both succeed to match).
- Value-only searching:
- Enter a single value (without a colon, unlike Key:Value searching) - This will search for that value within all attributes, matching both the key and value of the attributes.
- E.g. searching for color will match an attribute named Color (regardless of its value!). It will also match an attribute named Description if the value of that attribute is "I like colorful things".
- Quoting:
- Using quotes such as "double quotes" or 'single quotes' enables searching for terms that have spaces in their name.
- E.g. searching for "Alarm Severity":warning will look for an attribute named 'Alarmed Severity' whose value contains the word 'warning'.. If the quotes weren't used then the word 'Alarm' and the word 'Severity' would not form part of a single attribute key and we would be searching for them as independent search terms. Consequently we would get very different search results.