
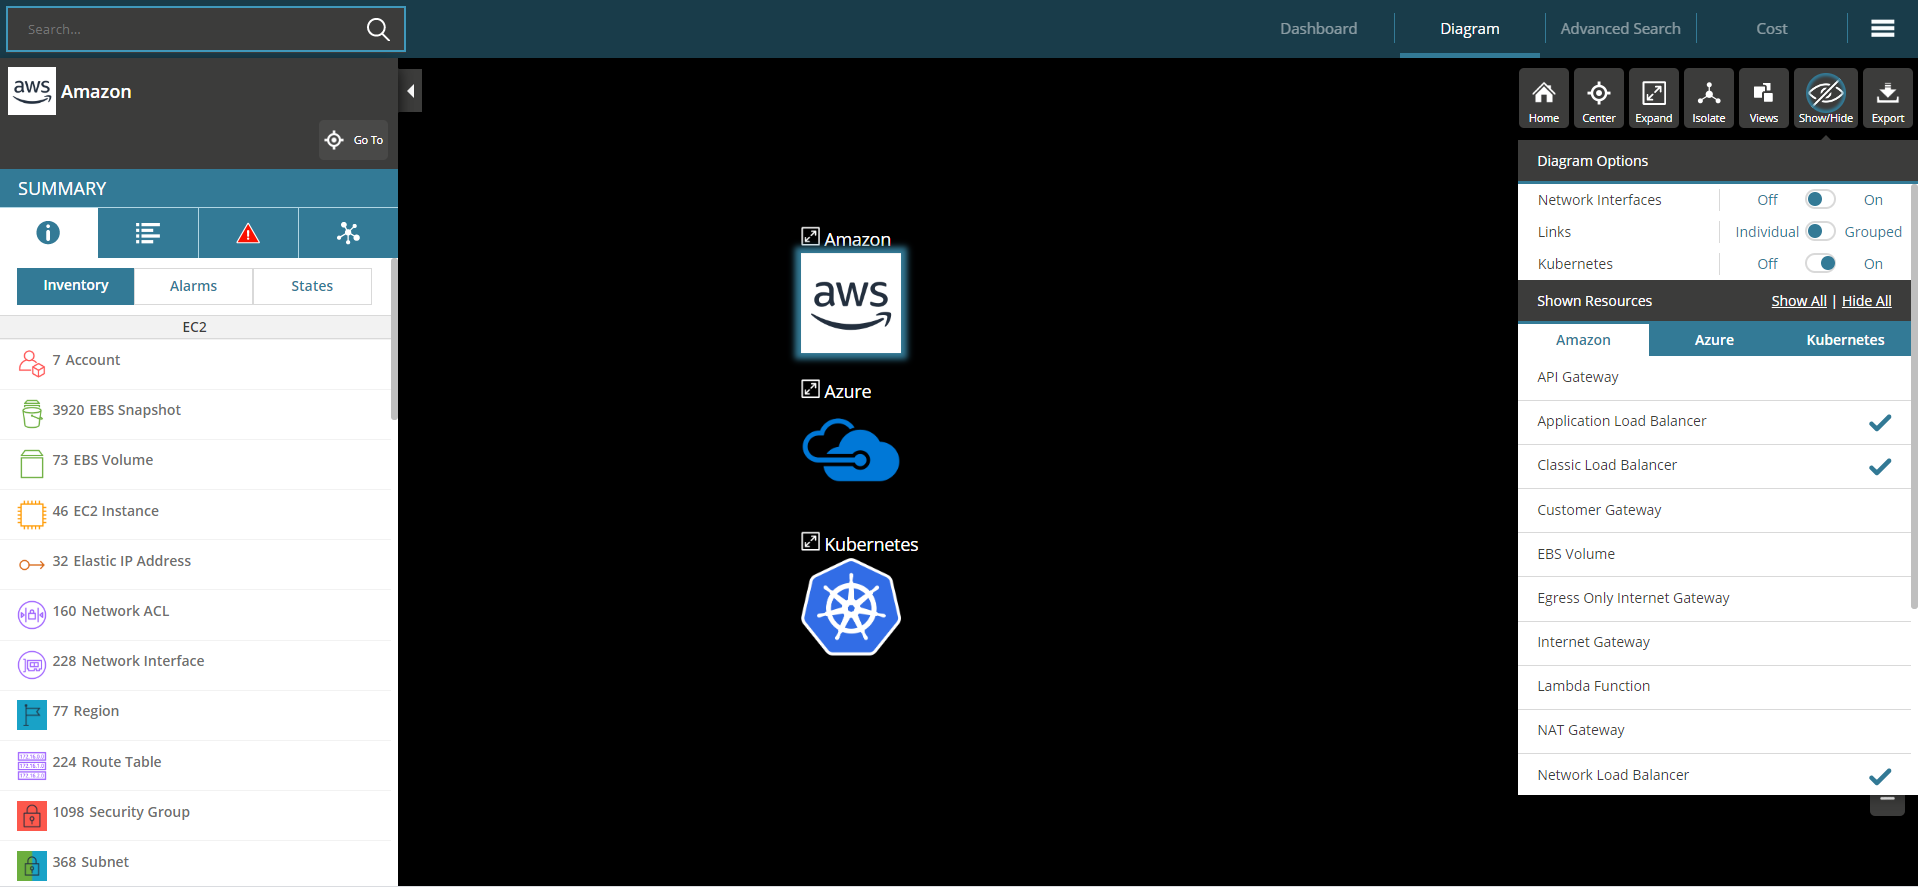
In the center: You can see the datasource groups. Click on the label to expand it or click on the icon to show more details.
Top-left: Search for any resource to find it in the inventory.
Top-Right (tabs in blue bar): Navigate to the main dashboard (showing your inventory & rules), or to the Diagram page (to see a real-time interactive diagram of your cloud) or to the advanced search page (to search all your resources based on their attributes and metrics and then save those searches into Rules) or to the Cost page to explore your billing costs and find out ways to optimise your cloud spend..
Top-Right (navigation bar menu): Configure account and other system settings as administrator.
Top-Right (buttons under blue bar): Controls for the diagram (see below).
Left: The group summary. After clicking on anything in the diagram you can view details of it here.
Right: By default you see the Show/Hide menu (see below).
Learning the Controls:
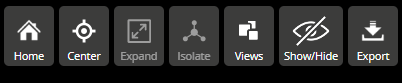
Home - Resets to this initial view and pre-selects one of the groups shown above.
Center - Centers the current diagram to fit the screen
Expand-All - Expands a selected group and all of its sub-groups (all the way down).
Isolate - Isolate a piece of the diagram in different ways
Views - VIew the diagram 'for' a particular tag.
Show/Hide menu:
- Show/Hide different resources
- Show/Hide interfaces
- Select link drawing mode (individual or grouped)
Export:
